F/3 EMU-65 and F/10 SE 200 Comparison
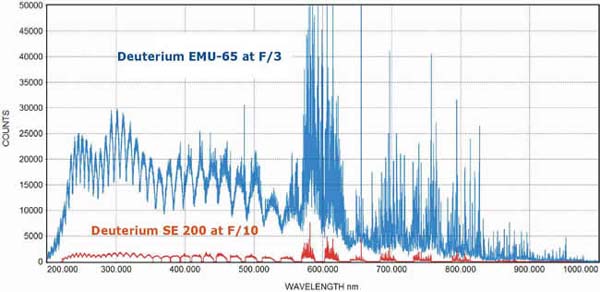
The above deuterium/tungsten spectra compare the throughput of the EMU-65 (blue curve) with the SE 200 (red curve) echelle spectrograph. The same Andor iXon +885 EMCCD camera was used for both spectra. The slit size was approximately the same for both instruments. The deuterium 656nm emission signal was slightly less than saturation for images from both spectrographs. The EMU-65 exposure was 0.13 seconds and the SE 200 exposure was 3.75 seconds. The EMU-65 spectrum was multiplied by 28.35 (3.75/0.13) to normalize the two curves to the same exposure time.
The above spectra show that the EMU-65 at F/3 has 12x to 14x higher throughput than an F/10 spectrograph like the SE 200.
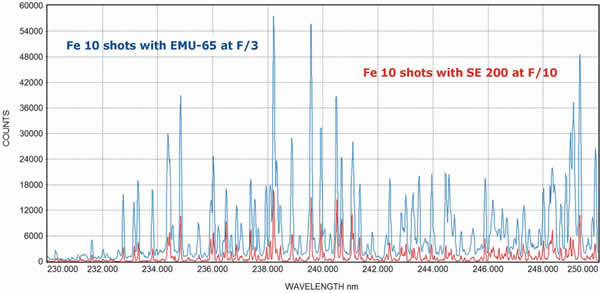
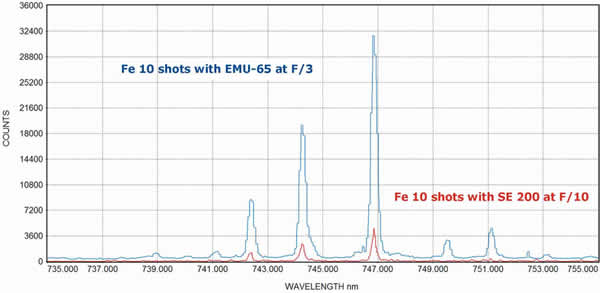
The above LIBS (laser-induced breakdown spectroscopy) spectra of Fe compare two echelle systems:
- the EMU-65 using an Andor iXon +885 EMCCD camera (blue curves)
- an SE 200 using an Andor ICCD camera (red curves)
Both spectrographs used similar sized slits and 10 laser shots were accumulated for each spectrum. The gate times were > 10 microseconds. The same optical fiber and fused silica light collecting lens were used on both systems. The light collecting lens did not have a fast enough beam to fill the F/3 input aperture of the EMU-65, so the throughput of the EMU may be even better than indicated. The above spectra were acquired at Los Alamos National Laboratory.
| For more information, please contact us: |
Catalina Scientific 2555 North Coyote Drive, Suite 113 Tucson, AZ 85745 USA Phone: 520-571-8000 |
Entire site copyright © 1998-2026, Catalina Scientific |