SE 200 KestrelSpec Spectral Curves
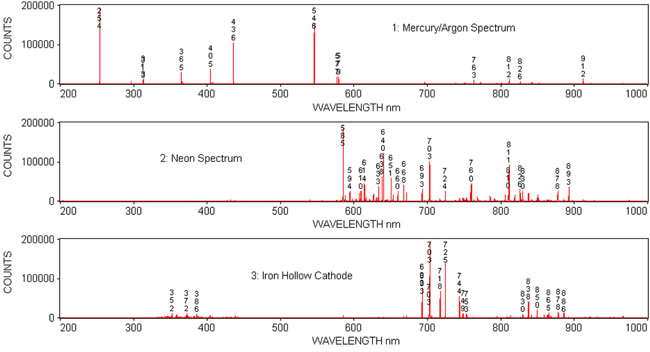
Each spectrum was created from just one image acquired with a back-illuminated, 512 x 512 CCD camera. KestrelSpec software was used to combine the various orders, normalize the spectral sensitivity, linearize the spectrum, and plot the results from 200nm up to 1 micron. The Neon-Iron Hollow Cathode spectrum has an absorption filter in the light path to reduce the intensity of the neon lines.
| For more information, please contact us: |
Catalina Scientific 2555 North Coyote Drive, Suite 113 Tucson, AZ 85745 USA Phone: 520-571-8000 |
Entire site copyright © 1998-2024, Catalina Scientific Website hosted by Maplegate Tech |